Position sizing is one of the most important aspects of successful trading. Whether you’re trading stocks, forex, crypto, or futures, knowing exactly how to calculate position size for a trade can be the difference between long-term success and draining your your account. Every single successful trader manages risk through position sizing. Limiting losses is key to staying in the game for the long-term.
In this guide, we’ll walk through exactly how to calculate position size using a simple formula, with full examples, screenshots, and a powerful (and free) position sizing calculator you can use for all of your trades.
This guide is perfect for:
- Stock traders
- Cryptocurrency traders
- Forex traders
- Trend followers and TurtleSignals users
- Anyone trading with real money and serious about managing risk
Let’s dive in.
Why Position Size Matters More Than You Think
Many traders obsess over entries. Some even worry about exits. But very few give the same attention to how much of their account they should actually risk on each trade.
The result? Oversized or undersized positions, emotional exits, and catastrophic drawdowns.
The best traders in the world — from the original Turtle Traders to modern-day systematic funds — all have one thing in common: they control their risk by calculating their position size based on predefined parameters.
This allows them to:
- Limit losses
- Stay in the game long enough for their edge to play out
- Trade with consistency and confidence
The best part is the calculation is incredibly simple, or, use an online calculator like the Position Size Calculator provided by TurtleSignals. There’s even a built-in calculator within TradingView. We’ll show you how to use all three in this tutorial.
The Core Formula: How to Calculate Position Size
Here is the foundational formula:
Position Size = (Account Value × Risk %) ÷ Loss Price Difference
Where:
- Account Value = The total trading account value
- Risk % = how much you’re willing to risk on that trade (commonly 1–2%)
- Loss Price Difference = Entry Price – Stop Loss Price
This gives you the number of shares, units, or lots to trade based on how much you’re willing to lose for that trade.
Tips:
- Risk % – As mentioned, we want to keep this below 2%. Any higher than this and your chances of getting wiped out increase very quickly. To be clear, this value represents the amount of your total account you’re willing to lose on the trade. This is not the value of your position, but the value of your potential loss. For example, if your trading account is $5,000 and you use 2% risk, that’s $100 potential loss if your stop loss is hit. The actual trade amount may be more than this, but it is irrelevant for the calculation.
- Loss Price Difference – The calculation is actually the absolute value of the Entry Price minus the Stop Loss Price. We need to use the absolute value because in a short position the Stop Loss Price will be higher than the Entry Price. Alternatively you can simply subtract the lower value from the higher value.
Let’s explore it further with some examples.
Example 1: Manual Calculation
In this example we’ll take a look at the BTC chart (ByBit exchange). Let’s say your strategy is to go long when MACD goes positive and RSI breaks above 70. This happens on November 6th, 2024 for BTC on the daily close. The image below shows our entry price on the blue horizontal line at $75,607.30. We’ll set our stop loss at a recent low, in this case the yellow horizontal line at $67,093.40. (This strategy is for illustrative purposes only, and is likely not a good strategy to use for actual trades).

Scenario:
- Account Value: $8,000
- Percentage to Risk: 2%
- Entry Price: $75,607.30
- Stop Loss: $67,093.40
Step 1:
Calculate the amount we’re willing to lose if the price goes against us, ie down:
Risk Amount = $8,000 × 0.02 = $160
So $160 is the amount we’re willing to lose if our stop loss is triggered.
Step 2:
Calculate Loss Price Difference:
$75,607.30 (Entry) – $67,093.40 (Stop) = $8,513.90
Step 3:
Now divide:
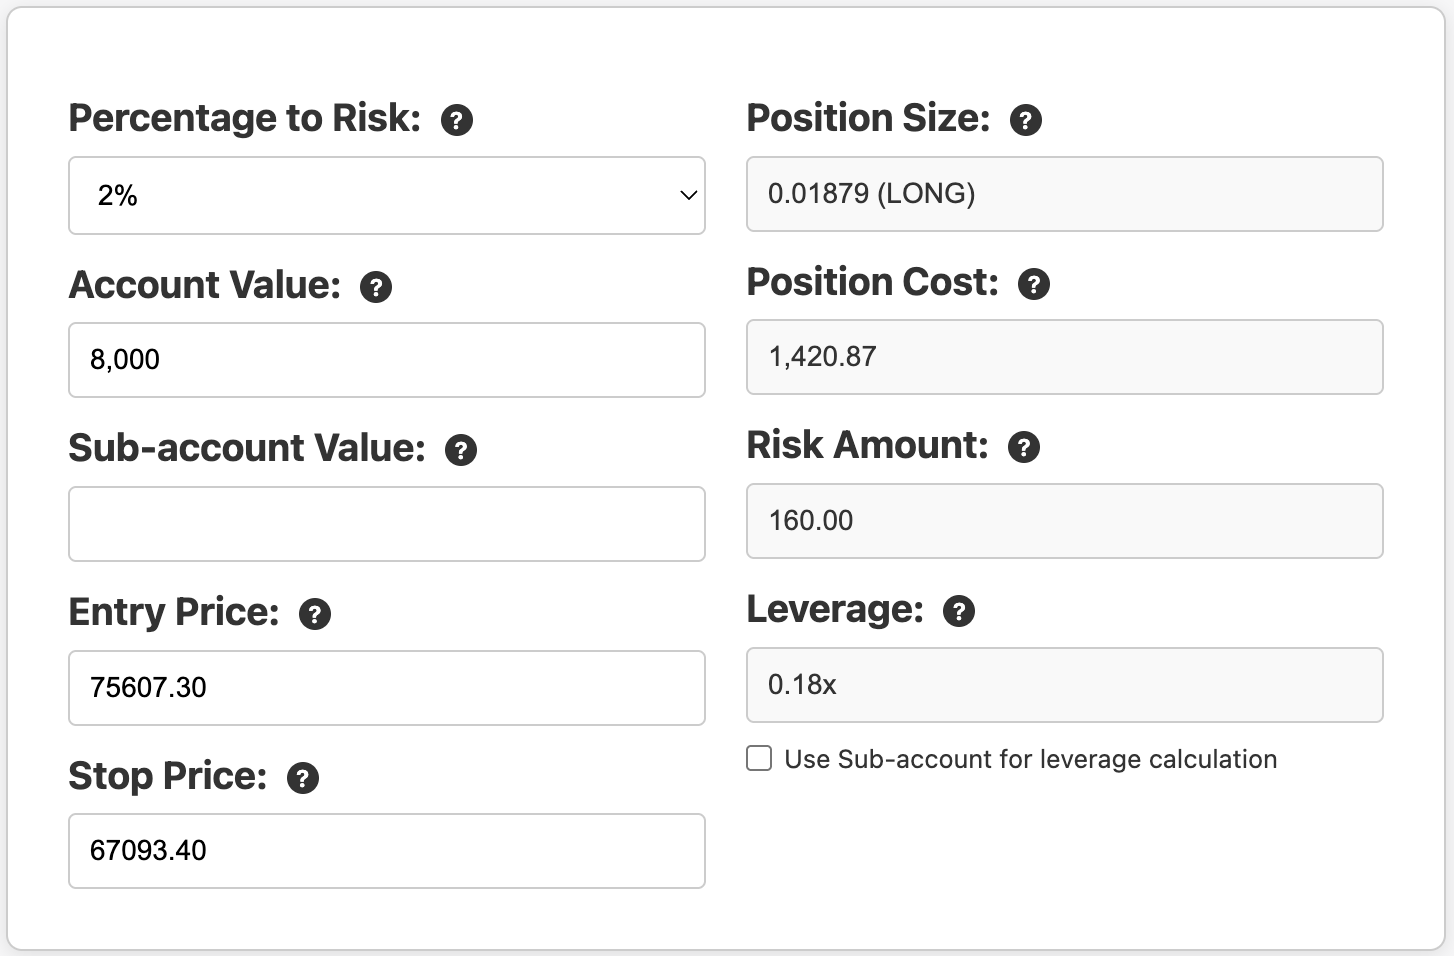
Position Size = $160 ÷ $8,513.90 = 0.01879 BTC
Final Position Size: 0.01879 BTC
Here, the actual value of the trade is our entry price multiplied by the position size, so:
Position Value = 0.01879 x $75,607.30 = $1,420.66That should make it clear that even though our total trade value is $1,420.66, we’re only risking a total of $160 in the event the trade goes the other way and hits the stop loss.
That’s it! The formula works for any crypto, stock, forex, etc.
Here’s what that looks like using our calculator:
Understanding Leverage
Leverage is a calculated result and an indication of the size of the trade compared to our total account size. This is especially useful for margin or forex traders where it’s not unusual to be in positions several times the size of your account (or sub-account).
Unfortunately, nowadays the cryptocurrency exchanges have distorted the meaning and point of leverage. On these exchanges you first need to select a leverage setting (for perpetual futures) before deciding on your trade size. This obscures your actual risk, encourages poor trading habits, and ultimately only benefits the exchange. If you are trading perpetual futures on ByBit for example, use a leverage setting of 1 and adjust it up if needed based on the output of the calculation. And always use isolated margin. Check the “Use Sub-account for leverage calculation” option in the calculator to show what your actual leverage will be for the isolated margin.
Example 2: Using TradingView’s Built-In Position Tool
In this example let’s a have a look at CrowdStrike Holdings (CRWD) on the NASDAQ. CRWD has great market structure with a consistent long-term set of higher-highs and higher-lows, and just exhibited a double bottom pattern, while breaking through a recent high.
Our entry will be at the recent high crossing of $392.69, and we’ll set our stop loss at a recent support line at $343.24 (yellow line).

Scenario: Long Trade on CRWD
- Account Value: $8,000
- Percentage to Risk: 2%
- Entry Price: $392.69
- Stop Loss: $343.24
For completeness sake, let’s first run the manual calculation.
Manual Calculation:
Risk Amount = $8,000 × 0.02 = $160
Price difference = $392.69 – $343.24 = $49.45
Position Size = $160 ÷ $49.54 = 3.23559 shares
Depending on your brokerage and the availability of fractional shares, you may need to round this down to an even 3 shares. In this case, the position value is:
Position Value = 3.23559 x $392.69 = $1,270.58
Now on TradingView:
Let’s repeat this but this time use the tools available in TradingView. While on the chart, select the Long Position tool:

Once selected, click on the entry position – price level and bar. Then drag the lower handle down (or up) to line up with the stop loss. It should look similar to this:

Now double click the middle box where it shows “Open P&L ….” and enter your account value and percentage to risk, then click OK:

Now in the middle box where it shows “Open P&L ….” it will also now show the Quantity of shares to buy.

In this case it rounds it down to a full share, ie 3 shares.
TradingView will also show the Risk to Reward Ratio if you set your exit position, making it a convenient tool for traders.
Lastly, let’s complete the exercise by using the TurtleSignals Position Size Calculator:
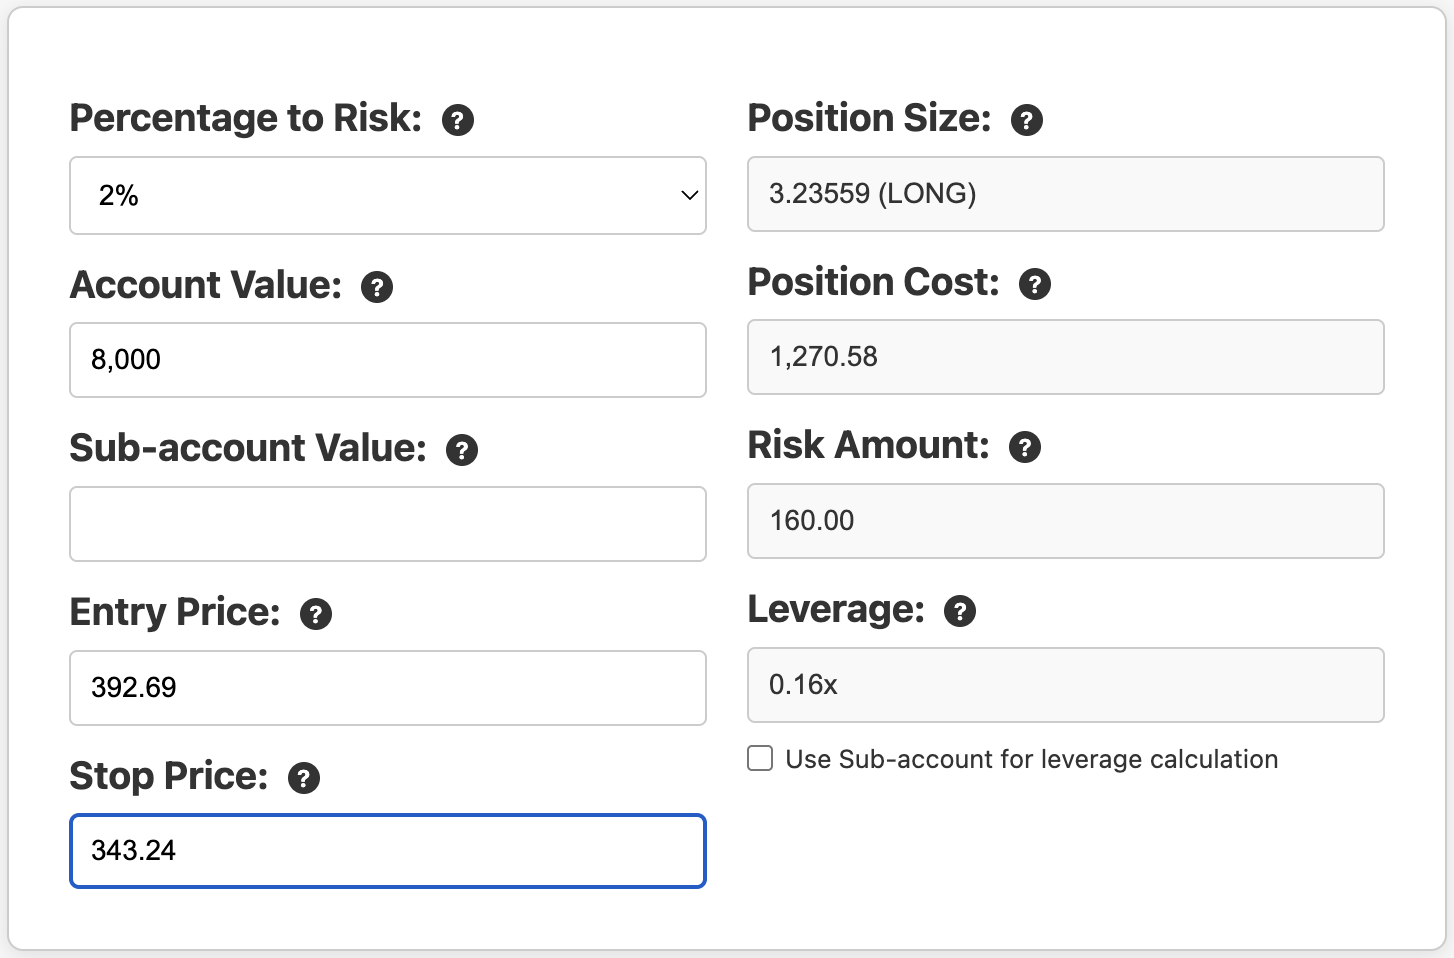
This calculator results are great for confirming the TradingView result.
Example 3: A Real TurtleSignals Trade
In this example we’ll look at a TurtleSignals entry signal and compare it’s position size calculation with the formula and with a slightly different version of the calculator used for Turtle trades.
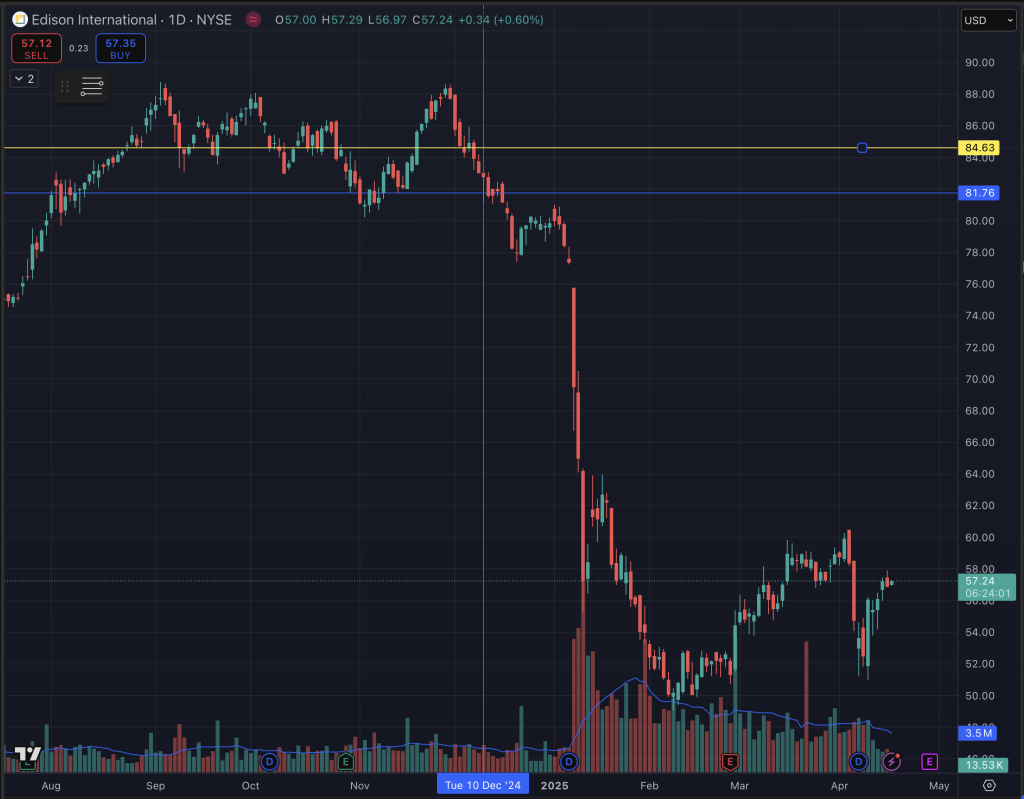
If you were part of our private Telegram group you would have received this short signal on December 10th 2024 for Edison International (EIX) on the NYSE:

It includes the trigger price of $81.76 as well as the stop loss level of $84.64.
On the chart below the entry is the blue line, and the stop loss is the yellow.
Scenario: Short Trade on EIX
- Account Value: $8,000
- Percentage to Risk: 2%
- Entry Price: $81.76
- Stop Loss: $84.64
We’ve set the Percentage to Risk at 2% as per usual. In the Turtle Trading system we always enter a trade with only 1 unit (or N) which represents 1% of account value. However, the stop loss is always set at “2N“, so the final funds at risk still works out to 2%.
For the stop loss, the Turtle Trading system uses a volatility-based stop — specifically, two times the 20-day Average True Range (ATR) — to calculate where stops go. The system calculated the ATR value at 1.439493, so double this to get the distance to our stop loss. The signal also provides the actual stop loss price.
Using the Calculate Position Size link in the signal in Telegram will open and pre-populate these values in a custom calculator. You only need to adjust your account value:

You can see the Unit Size is 55.57512. If we were to enter these values into our normal calculator, you’ll get the exact same result for the position size if we use 2% for the risk. Remember, the Turtle system has a stop at 2N, where N represents 1% of the account value. So we need to use a 2% value in the traditional calculator to get the equivalent Position Size of 55.55556 (minor difference due to rounding errors as the previous calculation uses the more precise ATR value):

We should note the Turtle Trading system uses a pyramid scheme for entries, hence only 1% is used on the initial entry. As the trend continues, additional units are added – up to 4 for each trade. This helps us limit our losses to only 2%, but use up to 4% of account value for winning trades – compounding our returns.
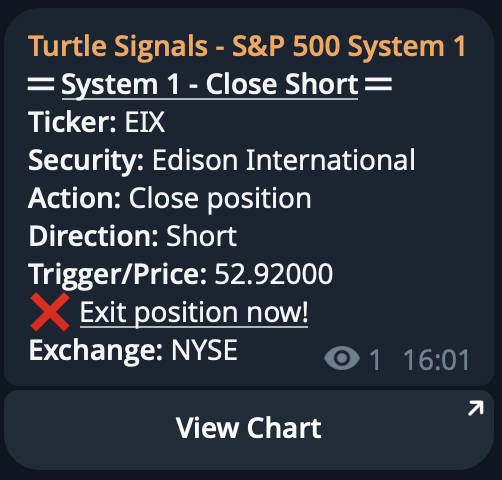
In case you were wondering, the Close signal came in on February 28th at $52.90 for a 35% return in just 11 weeks!
Tools Recap: Your Options for Calculating Position Size
We’ve covered three great ways to calculate position size based on risk essential for anyone trading:
1. Use the TurtleSignals Position Size Calculator
- Fast, accurate, includes leverage indication
- Preferences (values) saved in the browser
- Works for most markets: stocks, forex, crypto, futures
2. Use TradingView’s Long/Short Position Tool
- Great for also visualizing Risk:Reward ratio
3. Calculate it by hand
- Use the formula:
Position Size = (Account Value × Risk %) ÷ (Entry – Stop)
Why This Should Be Part of Every Trade
Whether you trade breakouts, pullbacks, or moving average crossovers, none of it matters if you don’t control how much you risk on each trade.
- You don’t need to win 70% of your trades.
- You don’t need to predict the market.
- You just need to manage your losses — and let your winners run.
And it all starts with position sizing based on a fixed amount risk. Never take a trade unless you already know how much you’re willing to lose if it goes against your hypothesis.
Final Thoughts: Master This One Thing
If you take away one thing from this guide, let it be this:
Great traders don’t just pick great trades.
They manage risk to avoid large losses when they’re wrong.
And that starts by knowing exactly how much to risk, where your stop goes, and how large your position should be.
Use the calculator. Test it with your strategy. Make it part of every single trade.
Your account will thank you.
Sign up to our newsletter to get similar articles delivered to your inbox.

Leave a Reply